Our Magical Journey Winning the Disney-sponsored 2021 Adobe Analytics Challenge

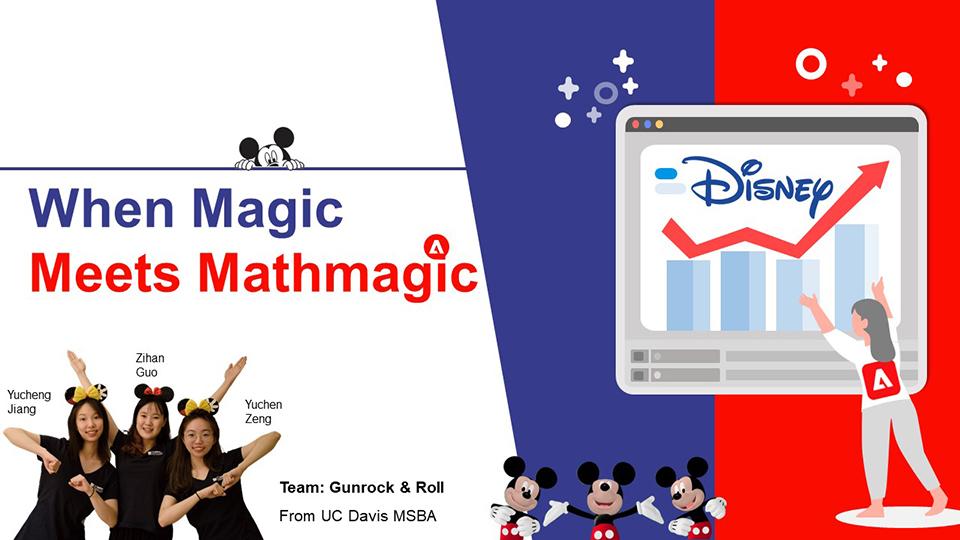
By Yuchen Zeng, Yucheng Jiang, and Zihan Guo, MSBA students, Team Gunrock n Roll
Over 8,000 students on more than 4,100 teams from more than 20 countries competed to be crowned the best university analytics team in the world in the 2021 Adobe Analytics Challenge.
As students in the UC Davis M.S. in Business Analytics program, we see the prestigious Adobe competition as one of the many great opportunities the program offers to help us sharpen our data analytics, business and communications skills.
Our team, Gunrock n Roll, was one of 10 UC Davis MSBA teams to enter the challenge. Now in its 19th year, Adobe describes it as “the world’s most valuable case competition for analytics” for college students.
We were thrilled to be one of two UC Davis MSBA teams that advanced to the semifinal round of 20 teams:
- Team KitKat: Kexin Fu, Ruxin Zhang and Joyce Chen. They were coached by Professor Elizabeth G Pontikes.
- Our team – Gunrock n Roll: Yuchen Zeng, Yucheng Jiang, and Zihan Guo. We were coached by Professor Prasad Naik.
We were honored to be selected among the six finalist teams from Brigham Young University, Indian Institute of Technology Kharagpur, Université d'Angers, Willamette University and Yale University.
We were floored when Adobe announced we had won during a livestreamed finals event on November 9, 2021. Not to mention that our first place award also came with $35,000 in prize money.
Our Path to No. 1
The Adobe Analytics Challenge is an analytics-focused business case competition where university students are given the opportunity to use Adobe’s industry-leading analytics products and access real-world data from leading organizations. Past customer partners include Nike, Major League Baseball, T‑Mobile, Starwood, Lenovo, Condé Nast, Comcast, Overstock.com, Backcountry.com, Sony PlayStation and MGM Resort International.

This year’s customer partner: Disney. We were very excited to get started!
The Adobe Analytics Challenge this year focused on nurturing loyalty online, looking for insights that can better profile customer intent. Using Adobe Analytics tools, student teams conducted deep analysis of Disney’s online experience—from the online shopping cart to the mobile experience. The best ideas ultimately will help Disney deliver a magical experience online.
As a team, our task was to identify problems, provide evidence, make recommendations and quantify the financial impact, all based on Disney’s real data. Growing up, all three of us watched Disney movies and enjoyed the magical land Disney built. We really wanted to help spread the Disney dream and magic to more families.
This is our story of how we used MathMagic to make all this happen.
0-50%: Steep Learning Curve
The first challenge we encountered after starting the competition was getting familiar with the interface of Adobe Analytics. We were a bit nervous at first because we didn’t have any related experience. We needed to be acquainted with every function in Adobe Analytics in an extremely short time.
In addition, we had little domain knowledge in e-commerce, so we could not make effective and practical suggestions unless we had a deeper understanding of the industry.
After the meeting with Professor Naik, he wiped our worries away. He is an incredible coach. In the previous three years, two of his teams placed second in this Adobe competition. He told us the challenges would be tough but resolvable. We began to explore the world of MathMagic in Adobe by trying different metrics to plot various graphs and using several functions like attributes comparison in Adobe Analytics. We also delved into the magic business world of Disney by reading relative papers about customer management in the e-commerce industry.
During the analysis, we faced many problems, like whether we built the segments in the right way, how to demonstrate the pattern more clearly, and which metrics to choose to conduct the customer segmentation. We went through hundreds of official documentation and tutorial videos to solve them.
In the first stage of the competition, we ate, slept and breathed Disney data. We discussed possible ways to answer Disney’s questions on our way to school, assessed each method's feasibility during lunch, and shared crazy dreams of how to celebrate.
Eventually, we found some inspiring perspectives during our brainstorming and analysis.
50%-90%: Breaking the Bottleneck
After the challenging process of initial exploration and studying, we were equipped with strong skills in Adobe Analytics and knowledge of various metrics. The question was how to apply this to solve our problems and transform this process into a vivid story. This was an arduous task, but completing this brought us from 50 marks to 90 marks. Reviewing what we did in this phase, three things were essential.
Choose the Right Metrics: Less is More.
In the beginning, we were intrigued by the richness of the Disney dataset and the power of Adobe Analytics. We produced countless fancy charts and tables but got lost in choosing the most meaningful. Luckily, with the guidance of Professor Naik, we finally selected the most important metrics and dug deeply into them. Those metrics were the key to our success.
Log-log Regression: Applying What We Learned in Practice
The next thing we did right was to apply what we learned in practice. When we tried to quantify the financial impact of our recommendations, we recalled the log-log regression we learned in Lecturer Mehul Rangwala’s statistics class. In this case, the log-log regression could give us the percent change in revenue regarding 1% change in a metric. The Adobe Analytics platform made this regression analysis a piece of cake.
Professional Yet Fun Storytelling
A good presentation needs to be professional to convince our audience and fun to grab and maintain their attention. To make our presentation professional, we kept our sentences short but strong. To add flavor to our storytelling, we designed an appealing hook and set up a joyful environment surrounding ourselves with Disney toys.
Professor Naik helped us a lot in improving our presentation. We even had a 5-hour meeting with him to fine-tune it.
90%-100%: Polishing the Presentation
Being selected for the final round meant our framework was logical, our analysis was solid, and our recommendations were valuable. In this phase, it was the way we presented the story that could make us stand out. It took a lot of effort to memorize scripts, design handover transitions, add proper gestures and concentrate on eye contact. The more we practiced, the more confident we became in our presentation and delivery.
The holistic theme of our presentation is magic, so we also added magic to our introduction video using editing techniques. Mickey Mouse, Stitch and Winnie the Pooh appeared in the video first, and they morphed into us one by one.
We put our diligence, creativeness and imagination into every aspect of the competition, holding the belief that we were going to win. But it was not about the award itself at the final stage. It was about breaking our limit, trying our best and leaving no regrets. With this in mind, we truly enjoyed the final presentation rather than being nervous and anxious. It was our best version and drew a perfect full stop to our journey.
Then we waited for the livestream of the finals. The competitors were strong, which made our hearts beat faster. As the announcer named the 6th place team, it was not us, nor the 5th, nor the 4th, and nor the 3rd! As the livestream Adobe host displayed comments from judges for the winner, we knew we had won. And it was real. Magic came true!
We are proud to represent the UC Davis Graduate School of Management as the winner of the 2021 Adobe Analytics Challenge!
Learn more about the Adobe Analytics Challenge and view video of the final awards ceremony >

