Success in 60 Days: Our Road to Runner Up at Adobe Analytics Challenge 2018
The Adobe Analytics Challenge business case competition tests university student teams’ ability to solve business problems using Adobe’s analytics products and real-world data from leading organizations.
This year's competition sponsor, wireless carrier T-Mobile, which has 77 million customers, asked teams to look for ways to better improve customers’ digital experience by using their website data.
Six finalist teams would be flown down to the Adobe campus in Lehi, Utah, for presentations, with the winner standing a chance to win the $35,000 top cash prize.
This is the story of how in 60 days we went from boot camp to runner up at the Adobe Analytics Challenge 2018.
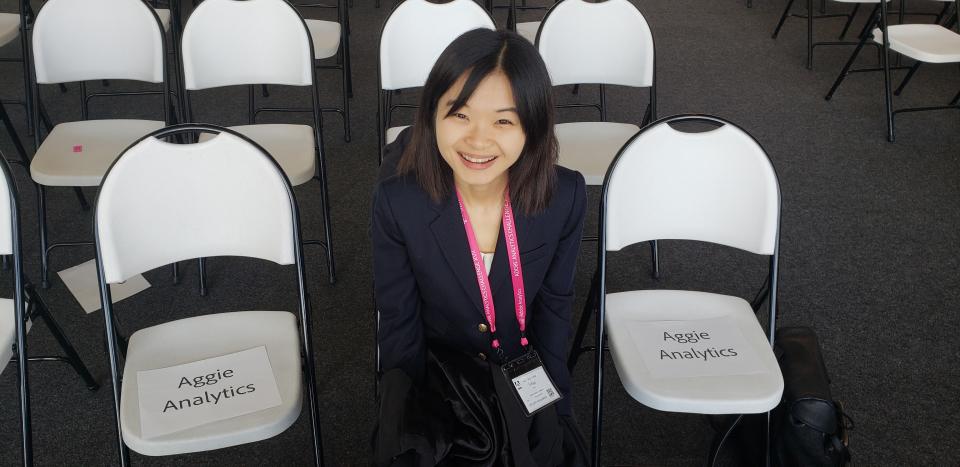
Day One: Aggie Analytics
Our team—Aggie Analytics, comprising of Yihui Chen, Xinyu Zhang and me—came together during our M.S. in Business Analytics boot camp. Each team required a mentor and we were fortunate to have Professor Prasad Naik to join us. He teaches marketing and advanced statistics in the UC Davis MBA and MSBA programs. With an experienced scholar in our corner, we were confident that at minimum we would walk away with a deeper understanding of how statistics works in the business world.
The competition registration closed on September 24 with the presentation deadline scheduled for October 10, which meant we had two weeks to make sense of the data and provide our analysis. Round 1 required us to provide our analysis in a Powerpoint.
Before to the competition, we had only one month of training in the analytics world during boot camp. As the coursework progressed, our team would try and connect what we learned in class to the T-Mobile problem.
After every class, we would have a quick chat to see how we could use what we learned right away. After much discussion and presentation versions, we finally compiled and entered our analysis with Adobe. Then we all got back to focusing on our classwork—and there was a lot of catching up to do.
To the Semi-finals and Beyond
A couple of days later just as we were about to leave class, I received a pop-up on my laptop screen titled: "AAC Round 1 Results." I opened the mail and halfway through the content I was already looking around the class for my teammates to share smiles.
We had made it to the semi-finals! We were one of 20 teams selected from 170 submissions.
For the semi-final round we were allowed to make a few changes to our presentation. With Professor Naik's guidance, we further tightened our analysis and presentation delivery, leaving no room for error. We had to present our analysis and provide a demo of how we used the Adobe Analytics tool to come up with our recommendations, the only catch being, it would be via a video call.
We knew we could not leave any stone unturned. Caffeine trips kept us going as we juggled between classwork and the competition. Under Professor Naik’s guidance, we thoroughly rehearsed our parts and tried to think of all possible questions that could come our way.
On the day of the video presentation via video, we felt confident of our work, me even more so, as I ensured I was on campus for the presentation and not on my notorious home Wi-Fi which always failed me on the internal group calls. The presentation went smooth, and then came the agonizing part, the wait for the results.
We’re Going to Utah!
A couple of days later, on October 23 I got a message from Xinyu: "Pack your bags, we are going to Utah!" We were in the final six and now stood a chance to win $35,000! All of us were elated!
Yet, there was little time to celebrate—the finals were nine days away on November 2. MSBA Executive Director Amy Russell quickly connected us with UC Davis experts in the art of communicating and presenting. MBA lecturers Brian Kennedy, who teaches “Articulation and Critical Thinking,” and Doy Charnsupharindr who leads the “Storytelling for Leadership,” class, generously volunteered to help us refine our skills—from how to pace, stand, make contact with the audience and more.
Thanks to our academic director, Associate Professor Ashwin Aravindakshan, we also had the opportunity to present to our classmates, which gave us a dry run of what it would be like to present a business problem on stage.
Day 60 at Adobe Analytics Challenge Finals
Adobe graciously arranged for our flight tickets and hotel stay. Professor Naik and our team flew to Utah, excited and ready to take on the challenge. At a mixer Adobe held for all the finalists, we had the opportunity to learn about our competitors.
Four of the six teams were from MBA programs, which seemed rather intimidating at first, but it only strengthened our resolve to go in all guns blazing. After an exquisite dinner, we were back at the hotel rehearsing one last time before the final day. Professor Naik had probably heard our presentation one hundred times by now, each with the same enthusiasm. As the clock struck 12, we called it a night and retired to our rooms.
On the final day, rehearsals and scripts were a thing of the past. All that mattered now was our 15 minutes on stage. We were extremely satisfied with our presentation. The judges, too, seemed impressed. In the Q&A, the judges appreciated our recommendations rather than cross-examining our analysis. After the final presentations, the judges deliberated behind closed doors and soon emerged to announce the results.
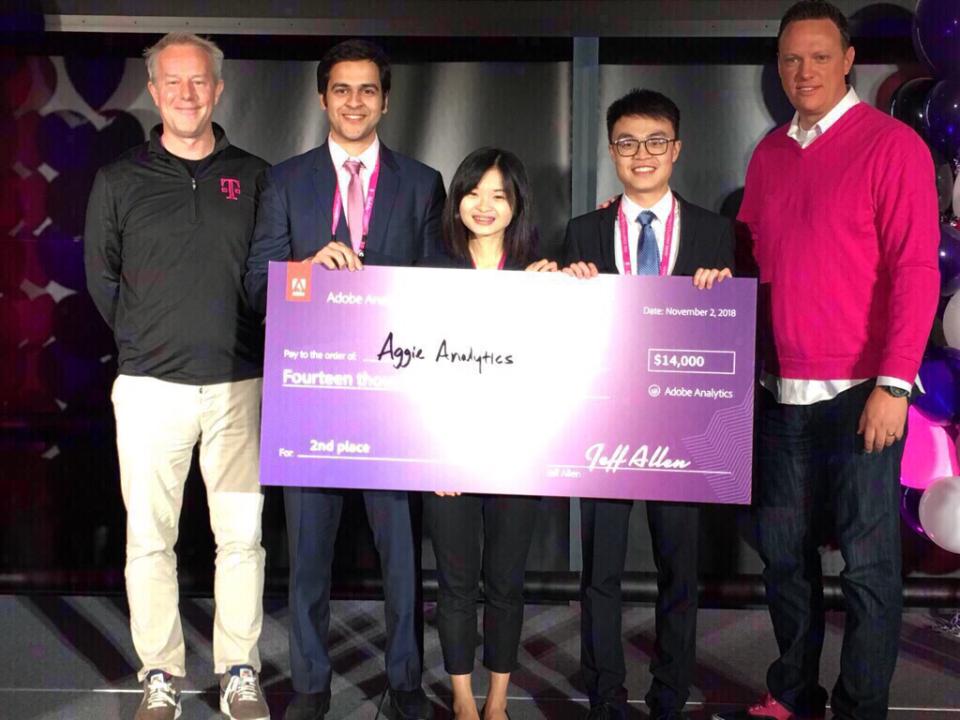
With all teams on stage, the countdown began. One by one the teams were assigned their position and before we could grasp the gravity of the situation, there we were on stage competing for the top two spots. The University of Utah were declared the winners with Aggie Analytics from UC Davis awarded second prize. We won $14,000, and passes to the Adobe Summit in Las Vegas next March.
Some Key Takeaways From My Teammates:
"This challenge gave me an opportunity to analyze real-world data, and think deeper about business problems, as well as how to use data analysis skills to solve those business problems. In addition, data visualization is important to give us an overview of the whole dataset."
— Yihui Chen
"How to tell a story based on data analysis is the key to a data analyst. Everyone can perform data manipulation, data visualization, and hypothesis testing, but what differentiate you is that you have a clear goal in mind and know how to convey your ideas and insights through storytelling."
— Xinyu Zhang
My biggest takeaway was the hands-on experience on how a complex business problem can be broken down to simple small chunks. The problem may seem overwhelming at first, but as you spend more time trying to understand it and breaking it down to simpler smaller chunks, the story gets clearer and clearer.
This victory would not have been possible without the support of our faculty who helped us polish our presentation, and the staff who was proactive by providing us with the resources required to succeed. And most importantly, our mentor Professor Naik, who motivated us, guided us through each and every step and, put in equal number of hours as we did to ensure we were fully prepared for the task at hand.
This win was a big team effort, and I am extremely proud to be part of the UC Davis community.
Go Aggies!