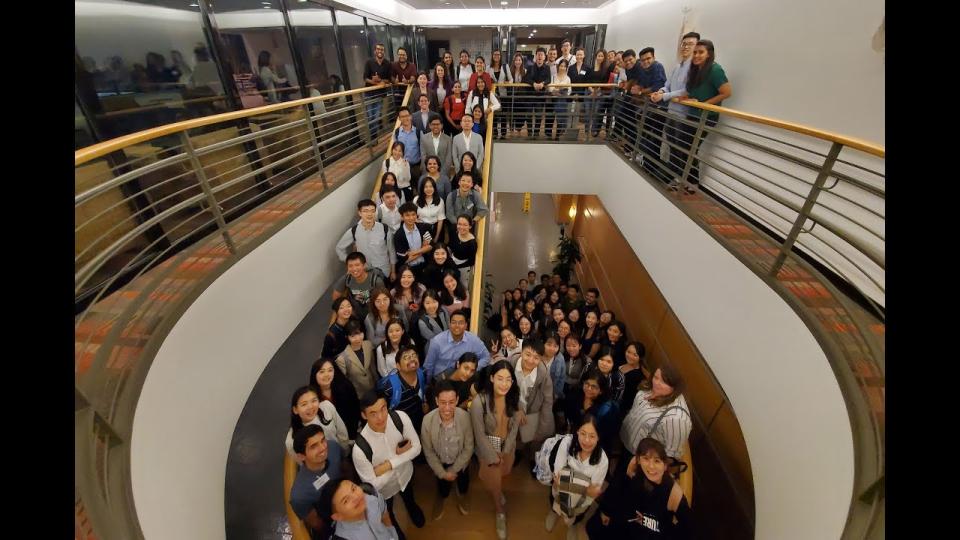
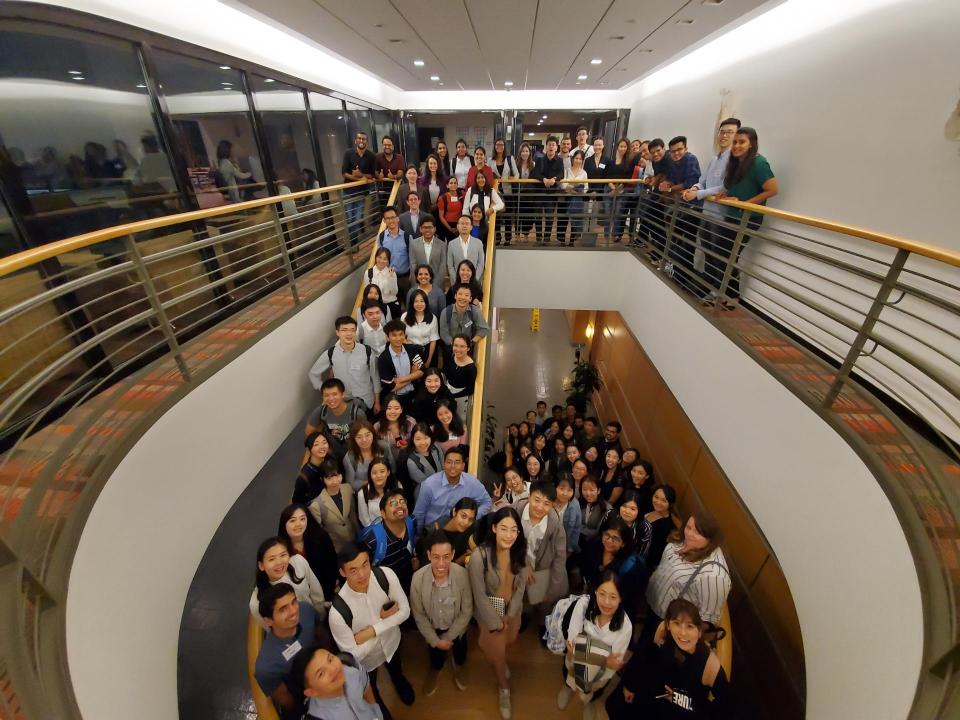
Largest M.S. in Business Analytics Cohort Kicks Off in San Francisco
Four-day orientation kicks off one-year program

It’s amazing to be surrounded by and having the opportunity to meet and work with 95 bright and ambitious classmates—the largest cohort yet of the UC Davis Master of Science in Business Analytics program.
We came from around the world, and now we all start in the same place—the 2019 MSBA orientation in San Francisco. The four-day event kicked off with an interactive session with four UC Davis MSBA alums and a guest executive from LinkedIn.
Here are my key takeaways from the panel discussion.
Alums Share Advice
Dane Hamlett MSBA 18 is a senior business analytics leader at Adobe, and he managed to balance work and school while in the UC Davis, making for a hectic schedule.

He stressed the importance for the art of storytelling, specifically how to put forward your ideas in a clear, concise and engaging way. On the technical front, he emphasized that the domain specific language SQL serves as the backbone of any analytics endeavor.
Also on the panel was Elaine Ma MSBA 19, who is in product analytics at AdRoll. She shared the importance of developing our interpersonal skills. She noted that improving our presentation skills can help maximize our impact and share our results in a meaningful way. This was powerful to hear and it’s something I look forward to working on.
Another alum of the charter class, Mei Yang MSBA 18, who is now at Google, shared about her career search strategy and approach. She offered valuable advice on the importance of getting certifications in AWS or GCP to help you stand out from the crowd of applicants. We also got a brilliant picture of what to expect going into the year ahead as she shared her practicum experience and what to look for in class.

Abhinav Chatterji MSBA 19, just joined the AWS team at Amazon. He shared tips and tricks on thriving in San Francisco, and how to maximize what you get out of the MSBA program.
As a student, Chatterji said he planned his year in a way that the pressure of moving to a new country, working with new people and the process of settling in was as smooth as possible—he said we should try to do the same. He emphasized how extraordinary the GSM network of students, alumni and faculty is, and just how helpful they can be.
Bonnie Barrilleaux, a data science manager at LinkedIn, walked us through the complexities behind metrics and the value of identifying the right ones. She completed a postdoctoral fellowship in genomics at UC Davis, and shared her incredible experience through her transition into data science.
“The orientation set the right tone at the kick-off event. Meeting new people from different backgrounds and cultures was very enriching and memorable.”
— Jaspowin Kaur MSBA 20
As an electrical engineer by training, I was curious to know more about the rigors of such a career transition from a firsthand perspective. So let’s dive into her talk and discuss the foundation of all analytics problems: Metrics.
Why Are Metrics Important?
Although many people believe metrics are trivial things and assume they know them already, they represent the underpinnings to measuring the success of a venture. To quantify the progress of any company, you must first identify the right metrics. To do this, you must:
- Know your data: For example, LinkedIn collects a massive amount of data every day. Sifting through this data is not an easy task, unless you know exactly what you are looking for, i.e. narrowing down the data using the right metrics.
- Keep in mind your end goal: LinkedIn respects the concept of members. Each member is essentially a source of revenue. So how you calculate ‘member value’ matters. Setting your initial goal can help you set the correct metrics in the first place.
- Understand the user's perspective: There are two aspects to the LinkedIn content ecosystem: authors and consumers. One wants to share their views and professional experience to the world, while the others read or view that content to stay informed, or they simply focus on connecting with others to build their professional network. In both cases, they ultimately want to build their reputation and be a part of this community.
- Define the right, true north metric: All of this goes into defining the member value metric. This is essentially quantifying the value provided to each LinkedIn member, based on what they were aiming to accomplish.
That’s the business side of it. So how do you design it?
"Instead of seeking one ideal metric, we select true north metrics that indicate our long-term goals, and support them with a suite of signpost metrics that tell us whether we’re headed in the right direction to achieve our true norths.
Signpost metrics can shed light on your true north metric’s weaknesses, balancing out its flaws. Creating a balanced portfolio of true north and signpost metrics creates a holistic view of the whole product ecosystem." —Bonnie Barrilleaux, Data Science Manager, LinkedIn
Barrilleaux blogged about and spoke to us about her thought process in designing metrics at LinkedIn, where they choose an ensemble of metrics that support each other. One set provides direction, while the others work for long term goals. Here are some of the fundamental properties that any ideal metric must have:
- Fast calculation: Fast is always subjective, but we need to appreciate the trade-off between getting quick results and getting accurate results.
- Minimal lag time: In order to actually get value from a metric, there cannot be a long wait between an event occurring and actually extracting a useful metric from it.
- Accuracy: Obviously one of the most important properties of any metric is accuracy.
- Dimensional cuts: One should be able to view and analyze the metric at any level of the data.
- Single source of truth: An ideal metric would be generated at one place but still be applicable and consumable all over the world.
- Measures something we need: A metric may not always measure the quantity we actually need due to physical limitations, but extrapolating from the closest sources is very important.
- Simple, actionable definition: A metric is not immune to time. It may need to be changed over time. But when it does, we need to be able to understand exactly why it needed to be changed, the reason behind it and how to go change it properly. Thus, the definition must remain accurate throughout those changes.
Despite all of this, Barrilleaux says there’s no such thing as a perfect, or ideal metric.

You’re not going to find the rules above always work out. For example, a metric with a short lag time, might not have the highest accuracy. Or, in order to establish a single source of truth, we might end up compensating on simplicity.
But there is no need to be disheartened. Just because the proverbial ‘unicorn’ metric does not exist, that does not mean we cannot progress. Getting the best possible solution is the goal. It might seem like a long and arduous process, but trust me, it is worth it.
As Barrilleaux summed up, "Metrics don't grow on trees… things go wrong, but that is how you learn and improve."
She added that metrics should start with the user’s goals and be designed to capture whether the user is successful. That is the ideal metric.